Cross Validation
What is Cross Validation (CV)
Let’s say we have 50 sets of data used to train a model. If we use all the data for training, then we don’t have any left to test it. Thus, a sensible approach is to split it 80/20, when 80% of the data is used to train the model, and remaining 20% is used to test it.
- data set 1-40: use for training
- data set 41-50: use for testing
However, we don’t know for sure if data set 1-40 is the best for training the model; neither do we used all the data available.
Cross Validation can solve the problem, or improve the model. Basically, we want to divide the data into K groups (K-folds), example 5 groups below. In each iteration / training process, 4/5 groups are used to train the model, and the last one for testing.
| Dataset 1-8 | Dataset 9-16 | Dataset 17-24 | Dataset 25-32 | Dataset 33-40 | Dataset 41-50 |
|---|---|---|---|---|---|
| Train | Train | Train | Train | TEST | HoldOut |
| Train | Train | Train | TEST | Train | HoldOut |
| Train | Train | TEST | Train | Train | HoldOut |
| Train | TEST | Train | Train | Train | HoldOut |
| TEST | Train | Train | Train | Train | HoldOut |
Hypothesis: Model trained with CV performs BETTER!
Setup
import numpy as np
import pandas as pd
import matplotlib.pyplot as plt
from sklearn.datasets import make_regression
# create 50 data points for the experiment
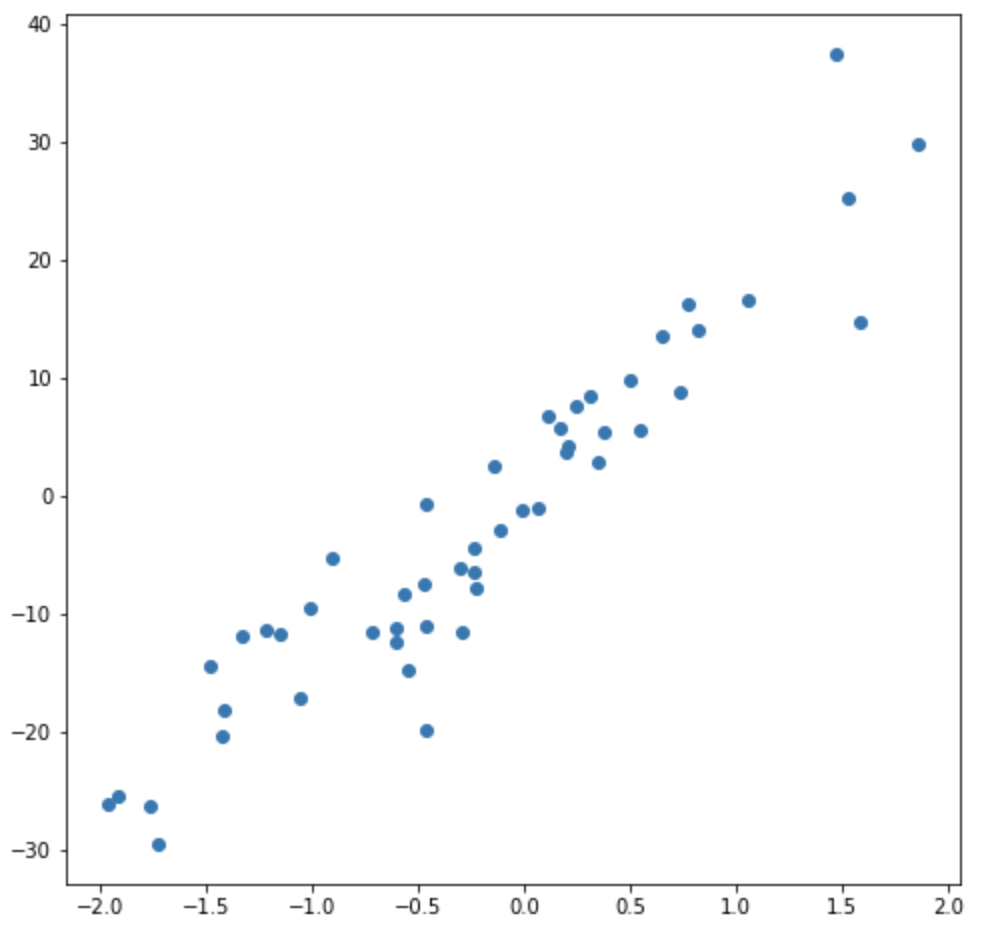
X, y= make_regression(n_samples=50, n_features=1, noise=5, random_state=42)
plt.scatter(X,y)

Split data in 80/20 with 20% for Test
from sklearn.model_selection import train_test_split
x_train, x_test, y_train, y_test = train_test_split(X, y, test_size=0.2, random_state=42)
print("x_train: ", x_train.size)
print("x_test: ", x_test.size)
# output
x_train:  40
x_test:  10
Train model as baseline
from sklearn.linear_model import LinearRegression
from sklearn.metrics import r2_score
from sklearn.metrics import mean_squared_error
# fit linear regression model to training set
linear = LinearRegression()
linear.fit(x_train, y_train)
# predit training set and test set using the model
y_train_pred = linear.predict(x_train)
y_test_pred = linear.predict(x_test)
scores = {}
scores["training set"] = {"r_2": r2_score(y_train, y_train_pred), "mse": mean_squared_error(y_train, y_train_pred)}
scores["test set"] = {"r_2": r2_score(y_test, y_test_pred), "mse": mean_squared_error(y_test, y_test_pred)}
print(scores)
# output
{'training set': {'r_2': 0.9082211858809777, 'mse': 20.77136285727775},
 'test set': {'r_2': 0.6761171340902208, 'mse': 36.679634983592294}}
Let’s use Cross Validation
from sklearn.model_selection import cross_validate
# CV is set to 5-fold
# R^2 and mse is used as scoring metrics
scores = cross_validate(linear, X, y, cv=5, return_estimator=True, scoring=('r2', 'neg_mean_squared_error'))
print(scores)
# output
{'fit_time': array([0.00079298, 0.00041986, 0.00042582, 0.00053477, 0.00041199]),
 'score_time': array([0.00068283, 0.00073123, 0.00070882, 0.00072026, 0.00058603]),
 'estimator': (LinearRegression(copy_X=True, fit_intercept=True, n_jobs=None, normalize=False),
  LinearRegression(copy_X=True, fit_intercept=True, n_jobs=None, normalize=False),
  LinearRegression(copy_X=True, fit_intercept=True, n_jobs=None, normalize=False),
  LinearRegression(copy_X=True, fit_intercept=True, n_jobs=None, normalize=False),
  LinearRegression(copy_X=True, fit_intercept=True, n_jobs=None, normalize=False)),
 'test_r2': array([0.83294462, 0.87513271, 0.85425891, 0.95260985, 0.86880153]),
 'test_neg_mean_squared_error': array([-28.66454405, -15.60107755, -47.62231841,  -6.01442767,
        -34.90107707])}
We can see the 4th model performs the best, with R^2 =0.95260985, and mse=-6.01442767. Using the best model to predict:
best_model = scores["estimator"][3]
y_train_pred_cv = best_model.predict(x_train)
y_test_pred_cv = best_model.predict(x_test)
from sklearn.metrics import r2_score
scores_cv = {}
scores_cv["training set"] = {
    "r_2": r2_score(y_train, y_train_pred_cv),
    "mse": mean_squared_error(y_train, y_train_pred_cv)
}
scores_cv["test set"] = {
    "r_2": r2_score(y_test, y_test_pred_cv),
    "mse": mean_squared_error(y_test, y_test_pred_cv)}
print(scores_cv)
# output
{'training set': {'r_2': 0.9051641686456118, 'mse': 21.463226386636407},
 'test set': {'r_2': 0.725591176478181, 'mse': 31.076714894393582}}
Conclusion
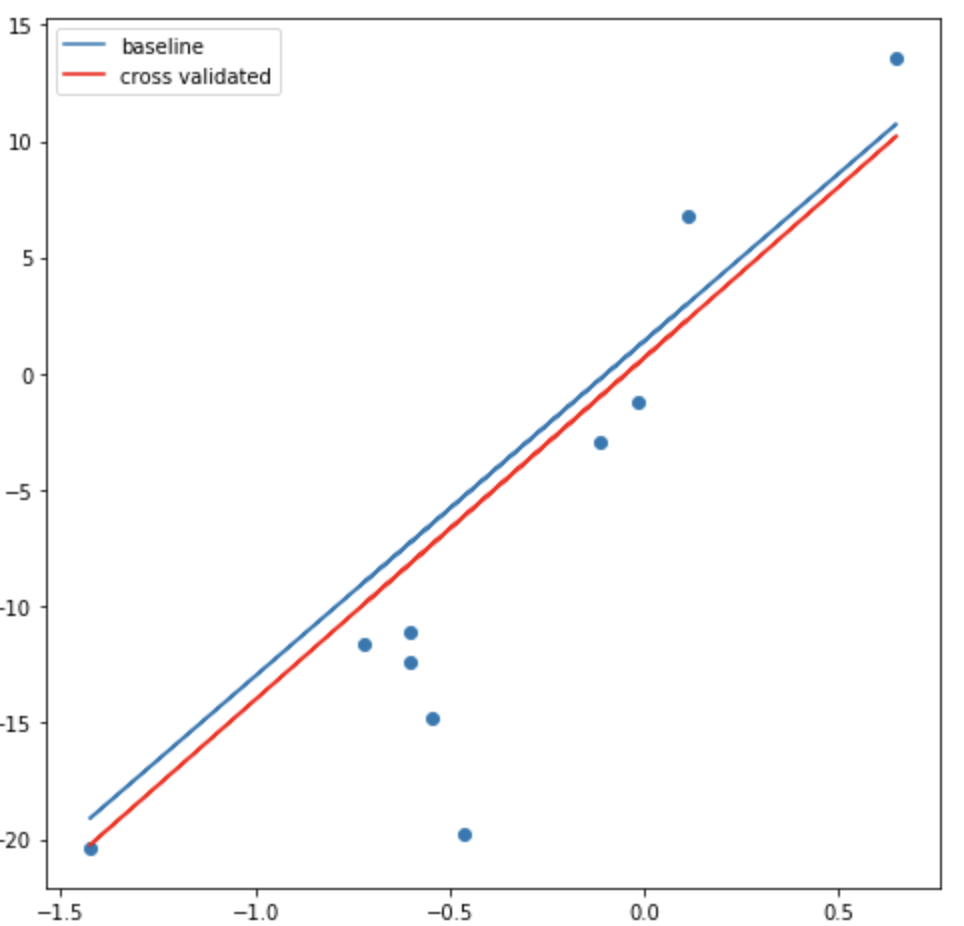
The model trained with CV performs better compared to the baseline, as
- R^2 is higher, 0.725 vs 0.676
- mse is lower, 31 vs 36
Below is the visualization below. Red line is the CV.
