P-value Interpretation
What is P-value
P-value is the probability of a random generated data, or something else that is equal or rarer. It is different from the probability of the event itself.
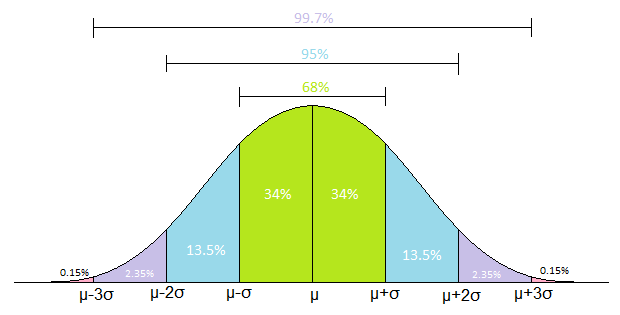
Take the normal distribution example below, the probability of even occur under the purple part on the right is about 2.35%.
P-value however, is the sum of probabiliy under 2σ (purple area) and &3σ (orange tails).
P-value = 2.35% + 2.35% + 0.15% + 0.15% = 5% = 0.05

Reference: a great video on p-value by StatQuest
Interpretation
Now we know how P-value is calcuated, how do we interpret different values?
- P-value(event) = 0.8
- there’s 80% probability of observing the event or something rarer
- which means it’s nothing special about this event
- P-value(event) = 0.001
- there is only 0.1% probability of observing this or something rarer
- it’s very unlikely to happen by chance
- it’s potentially VERY SIGNIFANT!